What is Log Tracing?
Tracing is a specialized use of logging to record information about a program's execution. This information is typically used by programmers for debugging purposes, and additionally, depending on the type and detail of information contained in a trace log, by experienced system administrators or technical support personnel and software monitoring tools to diagnose common problems with software. Tracing is a cross-cutting concern.
Ref: http://en.wikipedia.org/wiki/Tracing_(software)
In IBM RAD we can easily do the Troubleshooting by Configuring Logging and Tracing as per our Application Server Requirements.
In IBM RAD we can easily Configure the below Logging and Tracing:
Diagnostic Trace
JVM Logs
Process Logs
and IBM Service Logs
In this Post we discussed how One can Configure the Logging and Tracing for Diagnostic Trace in IBM RAD Admin Console.
Prerequisite :
1. One should have already created the WebSphere Application Server v6.1 @localhost in IBM RAD 7.5
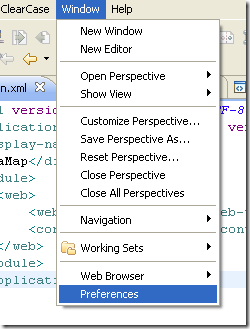
2. Server Should be in Started Mode. and Open/Start the Admin Console.
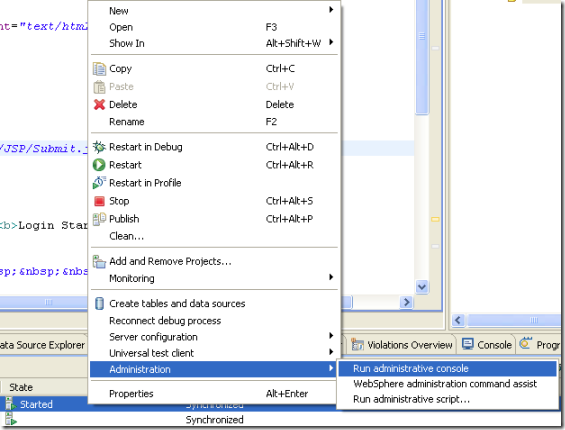
Step1: Open/Start Admin Console
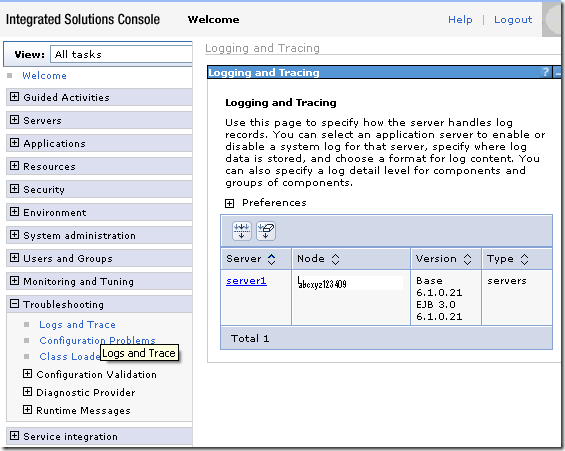
Go to Troubleshooting->Logs and Trace as show in the Screen below:
Step2: Check the server details as shown in the Screen above and click on server1
One Should get the below Screen:
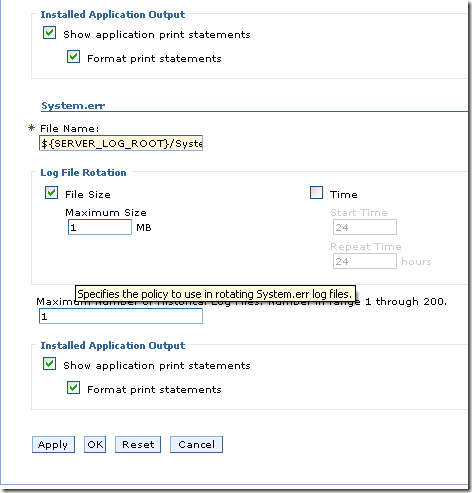
Step3: Click on Diagnostic Trace, One should the the Configuration Page as shown below:
Set the Configuration as Per Your App Server requirement.
Step4: Click Apply and OK.
Step5: Save the Settings.
One can Configure Diagnostic Tracing under Logging and Tracing in Admin Console for WebSphere Application Server v6.1 at Localhost with the help of same steps in all the other versions of IBM RAD i.e. RAD 6.0,RAD 7.0 and RAD 8.0.
